
Keyword
Earth Science | Oceans | Ocean Temperature | Sea Surface Temperature
702 record(s)
Type of resources
Topics
Keywords
Contact for the resource
Provided by
Formats
Update frequencies
Status
draft
-
Set of maps showing mean sea surface temperature in the Northern Marine Region for the wet and dry season. The CSIRO Marine Research Remote Sensing facility automatically receives and archives data from the USA's National Oceanographic and Atmospheric Administration (NOAA) satellites. Up to 18 passes per day are tracked to receive data. The Advanced Very High Resolution Radiometer (AVHRR) data is received on the High Resolution Picture Transmission (HRPT) signal. Within an hour of reception, these data are automatically processed into full resolution sea surface temperature (SST) images. Raw data originate from the AVHRR sensor on various NOAA polar orbiting satellites, received at various stations around Australia and consolidated ("stitched") by the CSIRO Earth Observation Centre. The stitching removes redundancy and minimises data corruption. Processing from the stitched archive to produce SST is carried out in the CMR Remote Sensing Facility in Hobart using the split window algorithm of McMillin for NOAA9 and NOAA12 satellites and the NLSST (NOAA non-linear SST) algorithm for the other satellites. Cloud-clearing is performed based on the algorithm of Saunders and Kriebel. Each map is made by combining the estimates over the composite period using a time and spatial neighbourhood median filtering method. Each pixel of the images is the 65 percentile of all cloud-cleared SST estimates during the composite period and within a 4x4 km region. The compositing process also removes most residual cloud contamination. These maps have been produced by CSIRO for the National Oceans Office, as part of an ongoing commitment to natural resource planning and management through the 'National Marine Bioregionalisation' project.
-
Set of twelve grids showing mean sea surface temperature for each month from data collected by CSIRO Remote Sensing Division from the USA's National Oceanographic and Atmospheric Administration (NOAA) satellites. These grids have been produced by CSIRO for the National Oceans Office, as part of an ongoing commitment to natural resource planning and management through the 'National Marine Bioregionalisation' project. Variations in onscreen colour representation or printed reproduction may affect perception of the contained data.
-
Sea surface temperature data, in 1, 3, 6, 10 and 15 day composite periods, at approximately 4 km resolution processed from NOAA Advanced Very High Resolution Radiometer (AVHRR) data received at Australian Stations and transformed to the stitched archive (see related record). Temporal coverage of the data is from October 1993-June 2003 and will be extended backwards and forwards through time. The data are in netCDF files and can be viewed as graphics or downloaded as data files from http://www.marine.csiro.au/remotesensing/oceancurrents/
-
GIS grid showing sea surface temperature total means from data collected by CSIRO Remote Sensing Division from the USA's National Oceanographic and Atmospheric Administration (NOAA) satellites. This grid has been produced by CSIRO for the National Oceans Office, as part of an ongoing commitment to natural resource planning and management through the 'National Marine Bioregionalisation' project. Variations in onscreen colour representation or printed reproduction may affect perception of the contained data.
-
ESRI grids showing sea temperature, linearly interpolated from CARS2000 mean and seasonal fields to 0.1 degree spaced grid, at depths of 0, 150, 500, 1000 and 2000 metres. The loess filter used to create CARS2000 resolves at each point a mean value and a sinusoid with 1 year period (and in some cases a 6 month period sinusoid - the "semi-annual cycle".) The provided "annual amplitude" is simply the magnitude of that annual sinusoid. CARS is a set of seasonal maps of temperature, salinity, dissolved oxygen, nitrate, phosphate and silicate, generated using Loess mapping from all available oceanographic data in the region. It covers the region 100-200E, 50-0S, on a 0.5 degree grid, and on 56 standard depth levels. Higher resolution versions are also available for the Australian continental shelf. The data was obtained from the World Ocean Atlas 98 and CSIRO Marine and NIWA archives. It was designed to improve on the Levitus WOA98 Atlas, in the Australian region. CARS2000 is derived from ocean cast data, which is always measured above the sea floor. However, for properties which do not change rapidly near the sea floor, this would not lead to a significant error. All the limitations of CARS2000 also apply here.
-
Temperature, linearly interpolated from CARS2000 mean and seasonal fields to 0.1 degree spaced grid, at depths of 0, 150, 500, 1000 and 2000 metres. The loess filter used to create CARS2000 resolves at each point a mean value and a sinusoid with 1 year period (and in some cases a 6 month period sinusoid - the "semi-annual cycle".) The provided "annual amplitude" is simply the magnitude of that annual sinusoid. CARS is a set of seasonal maps of temperature, salinity, dissolved oxygen, nitrate, phosphate and silicate, generated using Loess mapping from all available oceanographic data in the region. It covers the region 100-200E, 50-0S, on a 0.5 degree grid, and on 56 standard depth levels. Higher resolution versions are also available for the Australian continental shelf. The data was obtained from the World Ocean Atlas 98 and CSIRO Marine and NIWA archives. It was designed to improve on the Levitus WOA98 Atlas, in the Australian region. CARS2000 is derived from ocean cast data, which is always measured above the sea floor. However, for properties which do not change rapidly near the seafloor, this would not lead to a significant error. All the limitations of CARS2000 also apply here.
-
Map showing sea surface temperature total means from data collected by CSIRO remote sensing division from the USA's National Oceanographic and Atmospheric Administration (NOAA) satellites. This map has been produced by CSIRO for the National Oceans Office, as part of an ongoing commitment to natural resource planning and management through the 'National Marine Bioregionalisation' project.
-

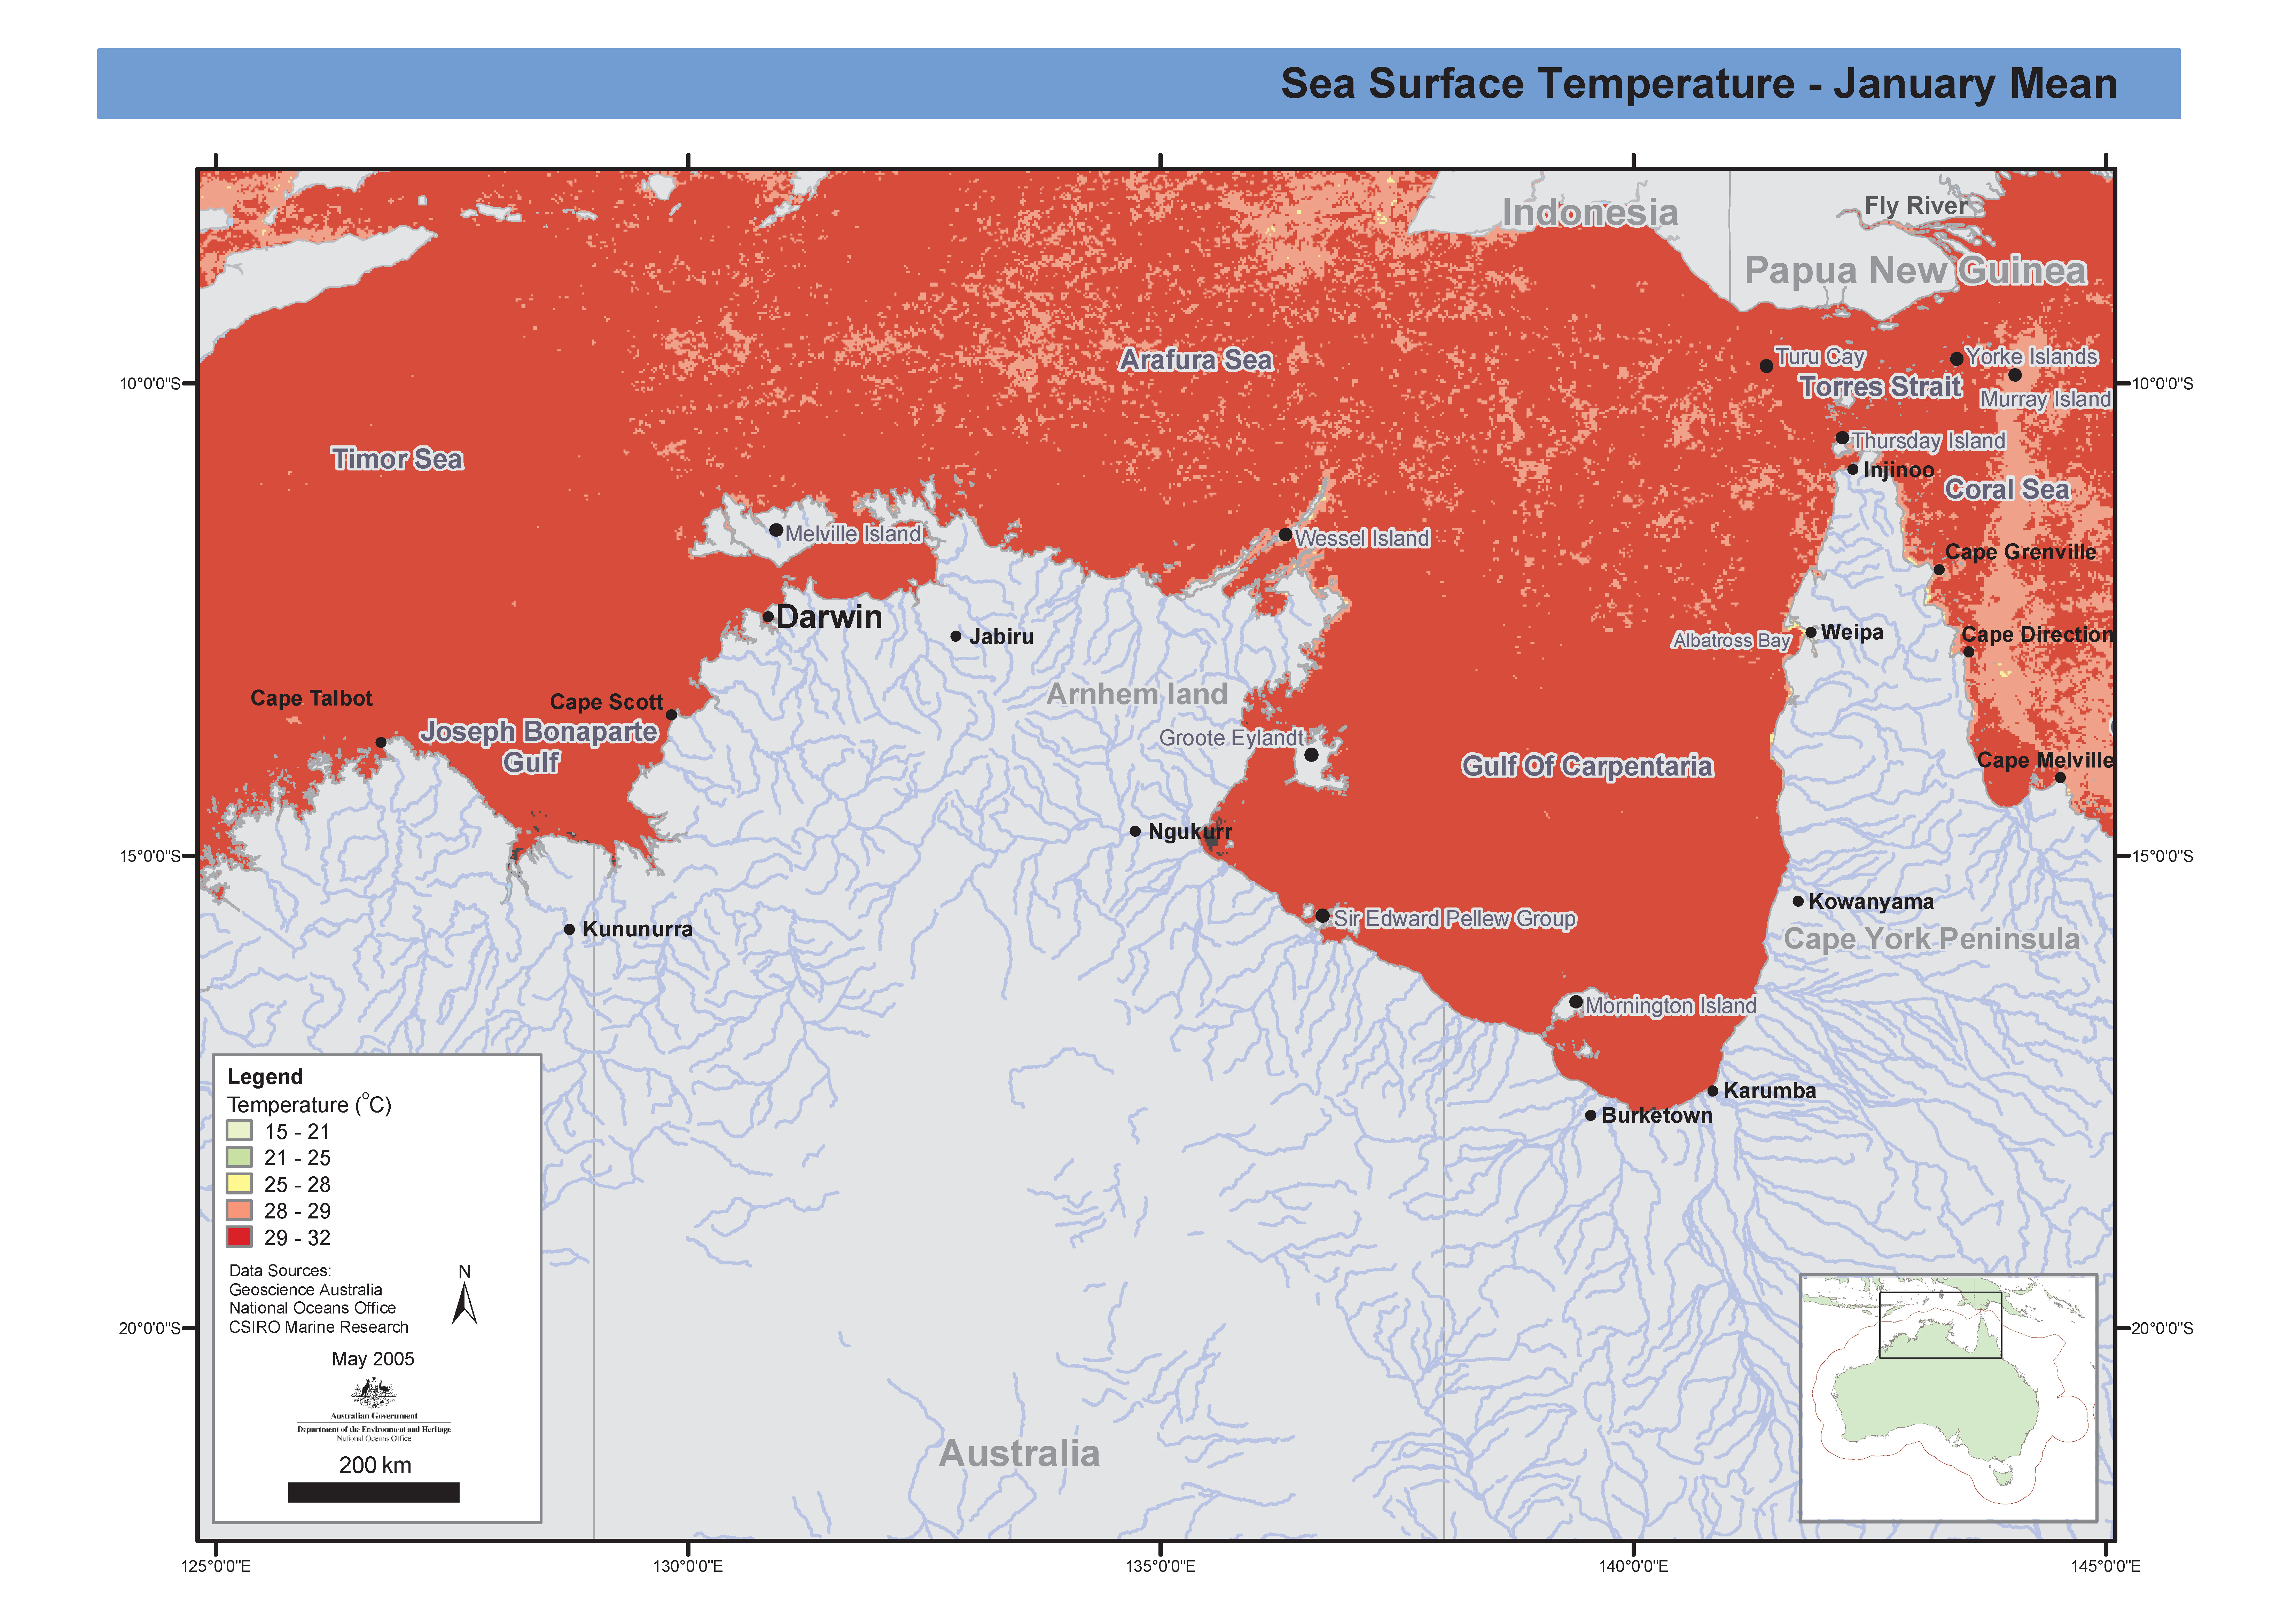
Map showing sea surface temperature quarterly and overall means in the Northern Marine region. The CSIRO Marine Research Remote Sensing facility automatically receives and archives data from the USA's National Oceanographic and Atmospheric Administration (NOAA) satellites. Up to 18 passes per day are tracked to receive data. The Advanced Very High Resolution Radiometer (AVHRR) data is received on the High Resolution Picture Transmission (HRPT) signal. Within an hour of reception, these data are automatically processed into full resolution sea surface temperature (SST) images. Raw data originate from the AVHRR sensor on various NOAA polar orbiting satellites, received at various stations around Australia and consolidated ("stitched") by the CSIRO Earth Observation Centre. The stitching removes redundancy and minimises data corruption. Processing from the stitched archive to produce SST is carried out in the CMR Remote Sensing Facility in Hobart using the split window algorithm of McMillin for NOAA9 and NOAA12 satellites and the NLSST (NOAA non-linear SST) algorithm for the other satellites. Cloud-clearing is performed based on the algorithm of Saunders and Kriebel. Each map is made by combining the estimates over the composite period using a time and spatial neighbourhood median filtering method. Each pixel of the images is the 65 percentile of all cloud-cleared SST estimates during the composite period and within a 4x4 km region. The compositing process also removes most residual cloud contamination. This map has been produced by CSIRO for the National Oceans Office, as part of an ongoing commitment to natural resource planning and management through the 'National Marine Bioregionalisation' project.
-
The United Kingdom Meterology Office (UKMO) Hadley Centre for Climate Research Global Sea Ice Coverage and Sea Surface Temperature dataset for the period 1870-present. Containing a combination of monthly globally complete fields of SST and sea ice concentration on a 1°x1° latitude-longitude grid from 1871 based upon a reanalysis of in situ sea surface observations and satellite derived estimates at the sea surface. The CSIRO version of this dataset has had all years concatenated to form one file and has been processed to calculate the following datasets: 1870-2006: Monthly & Monthly no-ice, Monthly Anomaly & Monthly Anomaly no-ice , Climatology & Climatology no-ice, Seasonal Anomaly & Seasonal Anomaly no-ice. 1870-2007: Monthly & Monthly no-ice, Monthly Anomaly no-ice, Climatology no-ice, Seasonal Anomaly no-ice. 1979-2005: Monthly, Monthly Anomaly, Climatology. 1980-1999: Monthly no-ice, Seasonal no-ice, Climatology no-ice.
-
Sea surface temperature data, in DISIMP images, from NOAA Advanced Very High Resolution Radiometer (AVHRR) data received at the ACRES station in Alice Springs. Data starts from Apr. 1991, and is calculated using an objective analysis procedure written in IDL. The images cover the Australian continent and surrounding oceans. The data are contained on CDROMs in Hobart.